How much has the Average Australian Household Finances Changed from 1997 to 2015
Figures from a recently released report from the Reserve Bank of Australia, show the average Net Worth, Property values, Financial Assets and Financial Liabilities of Australians,
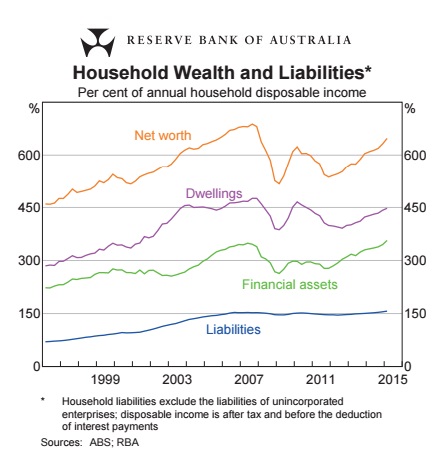
The chart below gives an indication of change from 1997 to 2015
Based on the Per cent of annual household disposable income, the average Net Worth has increased from about 450% to nearer 600%, even though the liabilities appear to have nearly doubled.
What this chart does show though, is that Liabilities are only about 150% of a persons annual household disposable income (after tax), compared to assets being well over 600% of a persons annual household disposable income.
