A comparison between 1984 and 2012, showing how median family incomes and median house prices have risen, during those 28 years.
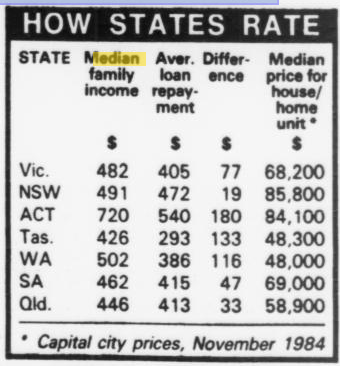
1984 Australian Property values

The above chart converted to a spreadsheet:
| Ratio | City | City Property Value | State Median Income |
| 3.4 | Sydney | $85,800 | $25,532 |
| 2.9 | Melbourne | $69,000 | $24,024 |
| 2.7 | Adelaide | $68,200 | $25,064 |
| 2.5 | Brisbane | $58,900 | $23,192 |
| 2.2 | Canberra | $84,100 | $37,440 |
| 2.2 | Hobart | $48,300 | $22,152 |
| 1.8 | Perth | $48,000 | $26,104 |
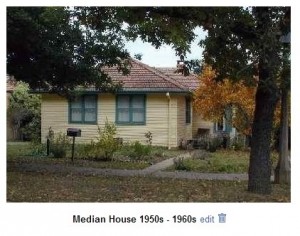
In 1984 the Sydney median house was a 3 bedroom, 1 bathroom and 1 garage property.
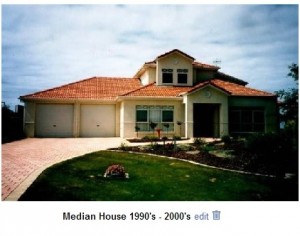
In 2012 the Sydney median house appears to be 4 bedrooms, 2+ bathrooms and a double garage property.
Median Incomes include all workers: Part Time, Retired, Full Time etc.
2012 Australian Property values
Using the ABS Median Household income figures, and the RP Data property figures, we get House Price to Income Ratios for 2012, as:
| Ratio | City | City Property Value | State Median Income |
| 7.3 | Sydney | $500,000 | $68,588 |
| 7.0 | Melbourne | $475,000 | $67,600 |
| 6.4 | Adelaide | $380,000 | $59,696 |
| 6.1 | Brisbane | $420,000 | $68,952 |
| 6.0 | Hobart | $320,000 | $53,352 |
| 6.0 | Perth | $455,000 | $76,232 |
| 4.7 | Canberra | $490,000 | $104,416 |
| 4.6 | Darwin | $425,000 | $91,468 |
Summary:
In 1984 a 3 bedroom, 1 bathroom and 1 garage property was 3.36 times the median income
In 2012 a 4 bedroom, 2+ bathroom and double garage property was 7.289 times the median income
So, in effect, the 2012 Four bedroom house was 2.1 times more (7.289/3.36) in real cost value to the older Three bedroom house.
People are choosing to pay a lot more for newer and larger houses.
How can median property prices change so much ?
An average house in the 1950s to 1960’s
An average house in the 1990’s to 2000’s


