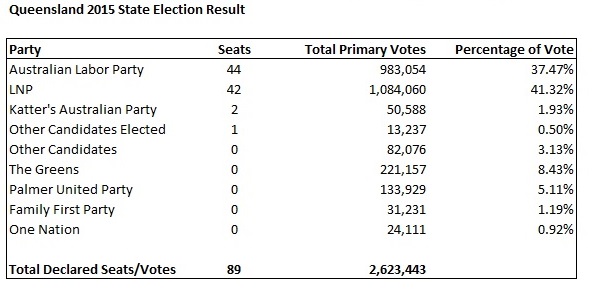
The Final Results for the 2015 Queensland State Election
With 2,679,874 votes submitted, and the Australian Labor Party (ALP) getting 37.47% of the Primary vote, they appear to have won 49.44% of the seats available.
The Liberal National Party (LNP) with 41.32% of the primary vote, get only 47.19% of the seats.
The remaining parties, with 2.43% of the primary votes, got 3.37% of the seats.
Primary Votes per party with the number of seats allocated to each party:
If Seats were calculated purely by Primary Votes, the result would have been closer to this:
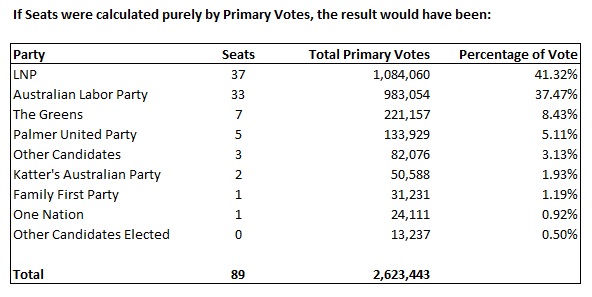
However, the way that elections work is that any votes given to the smaller parties, after the first two, are allocated to the main two parties in various methods.
In practice many voters are not aware of this system, and do not realise where there vote actually ends up.
Some people say that this is a drawback to compulsory voting, where a number of voters only vote to avoid being fined, and take no interest in the actual system until it is too late.
2.3% of Polling Booth Votes were disqualified
0.9% of Postal Votes were disqualified
This appears to show that those who make an effort to vote by post are more likely to understand the system, and get it right.
Out of the 2,679,874 votes submitted, only 2,623,443 were accepted, with 56,431 (2.2%) votes being rejected for being done incorrectly, for various reasons.
There were 2,981,145 registered voters for the 2015 Election. 357,702 more than the votes counted so far. 12% of the registered voters appear not to have voted.
http://results.ecq.qld.gov.au/elections/state/State2015/results/summary.html
