
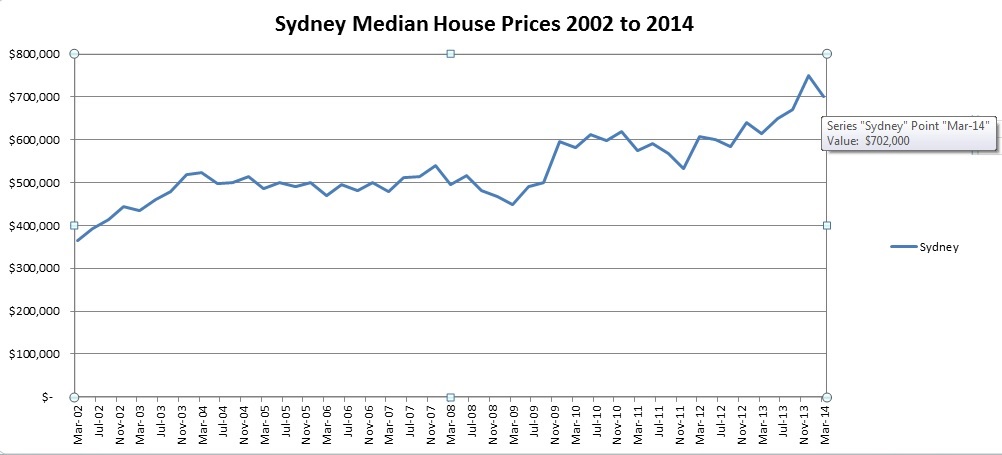
The median values of Freestanding Houses in Sydney between 2002 and 2014
The Australian Bureau of Statistics show that the Sydney Median House price has risen from $365,000 in March 2002 to $702,000 in March 2014.
This is a rise of 92.33% in 12 years. This work outs at an average annual rise of 5.6%.
Some figures to show the actual bi-annual median prices and changes are:
March 2002: $365,000
March 2004: $523,000 up by 43.29% in TWO years
March 2006: $470,000 down by 10.13% in TWO years
March 2008: $495,000 up by 5.32% in TWO years
March 2010: $583,000 up by 17.78% in TWO years
March 2012: $607,500 up by 4.20% in TWO years
March 2014: $702,000 up by 15.56% in TWO years
However, if we look at the odd years, also on a two year basis, we get these figures:
Mar-03 $434,500
Mar-05 $486,000 up by 11.85% in TWO years
Mar-07 $480,000 down by 1.23% in TWO years
Mar-09 $448,000 down by 6.67% in TWO years
Mar-11 $575,000 up by 28.35% in TWO years
Mar-13 $615,000 up by 6.96% in TWO years
The quarterly changes are:
This table shows the changes IF it had been an even rate of increase over the years:
| Year | Value | $ increase | % Increase |
| 2002 | $ 365,000 | $ 20,440 | 5.60% |
| 2003 | $ 385,440 | $ 21,585 | 5.60% |
| 2004 | $ 407,025 | $ 22,793 | 5.60% |
| 2005 | $ 429,818 | $ 24,070 | 5.60% |
| 2006 | $ 453,888 | $ 25,418 | 5.60% |
| 2007 | $ 479,306 | $ 26,841 | 5.60% |
| 2008 | $ 506,147 | $ 28,344 | 5.60% |
| 2009 | $ 534,491 | $ 29,931 | 5.60% |
| 2010 | $ 564,422 | $ 31,608 | 5.60% |
| 2011 | $ 596,030 | $ 33,378 | 5.60% |
| 2012 | $ 629,408 | $ 35,247 | 5.60% |
| 2013 | $ 664,655 | $ 37,221 | 5.60% |
| 2014 | $ 701,875 |
